- PowerBI Desktop is a free windows desktop application which we can install on our local computer that lets us to connect to our data, transform and visualize it.
- With MS PowerBI desktop application, we can connect to different data sources, combine them into a data model that lets us build visuals.
- We can share this collection of visuals as reports with other users within our organization using PowerBI Service (Online version).
- You can download and install it from here.
Welcome Screen
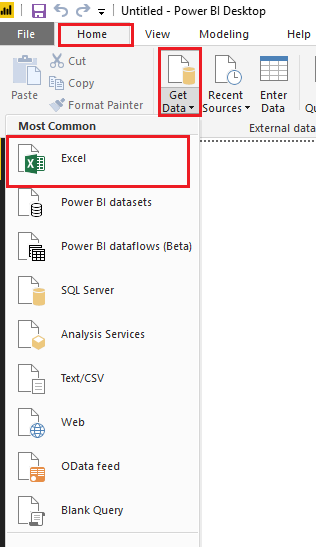
When you start PowerBI Desktop, you will see below Welcome Screen. You can Get Data, see Recent sources, open the reports that you have recently worked upon or can also open other reports by using the left pane. You can also look for other options like tutorials, blog, forums etc. on center and right side of this screen.

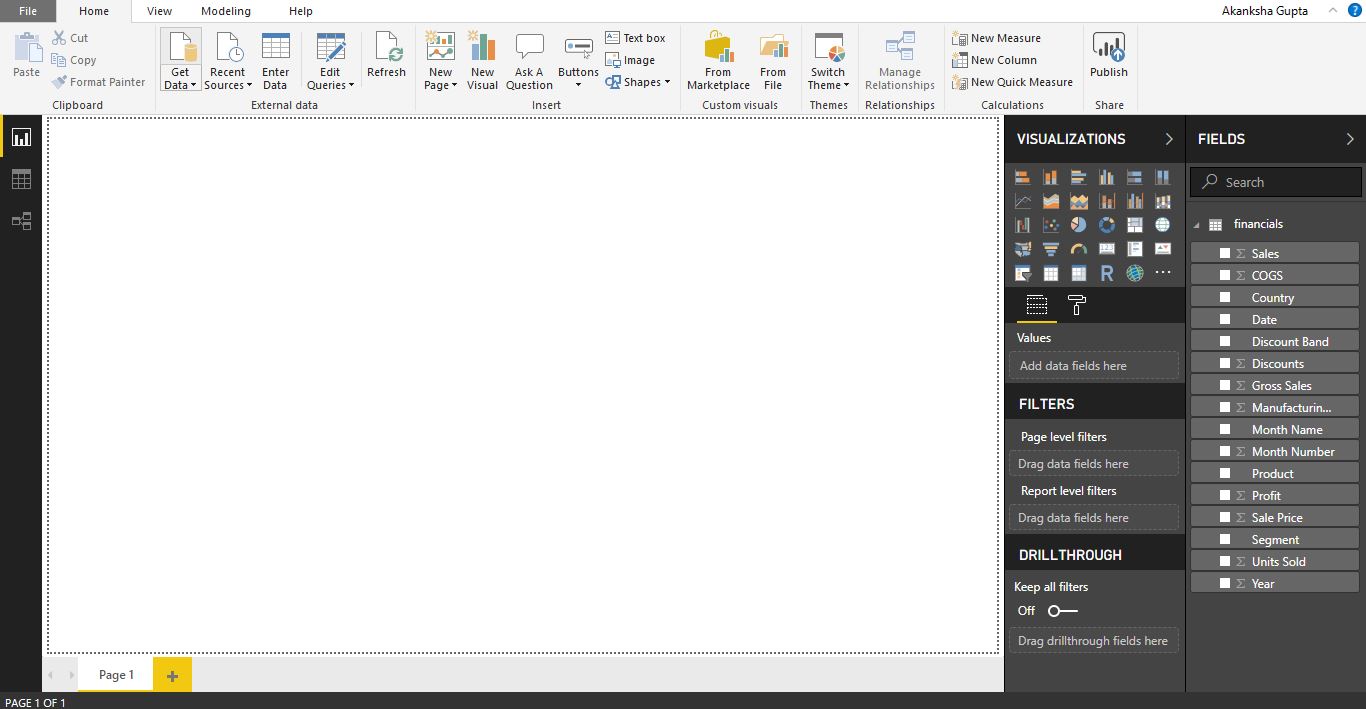
When you close the Welcome screen, you will see the Report view of PowerBI Desktop.

The three buttons on the left bar represent three views that are available in PowerBI Desktop: Report, Data and Relationships. The default view is the Report view. You can select whatever view you want. The Yellow Bar indicates the current view that is displayed.
You can view your current data in Data view, create relationships between different DataSets in Relationships view and create reports using this data in Report view.