The building blocks in PowerBI is used to create complex reports.
Let’s take a closer look at the building blocks:
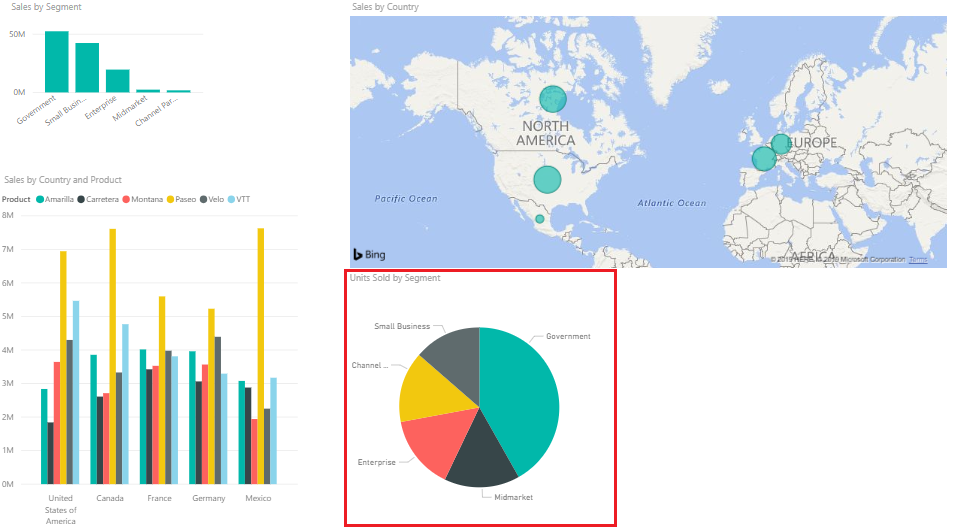
Visualizations
Visualization is a visual representation of data. This visual representation can be in form of charts, map or anything else that represent the data visually. Below is a visual representation of Customer Profitability Sample data.
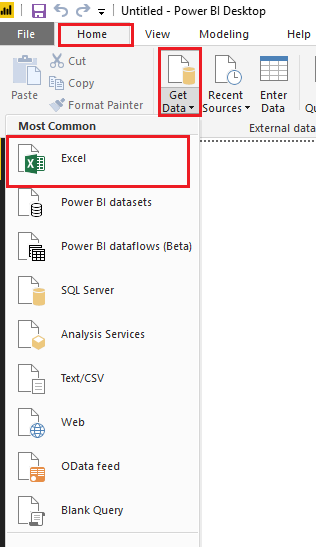
DataSets
A DataSet is a collection of data that is used by PowerBI to create visualizations. A DataSet can be anything from a simple Excel workbook to online data from any other source.

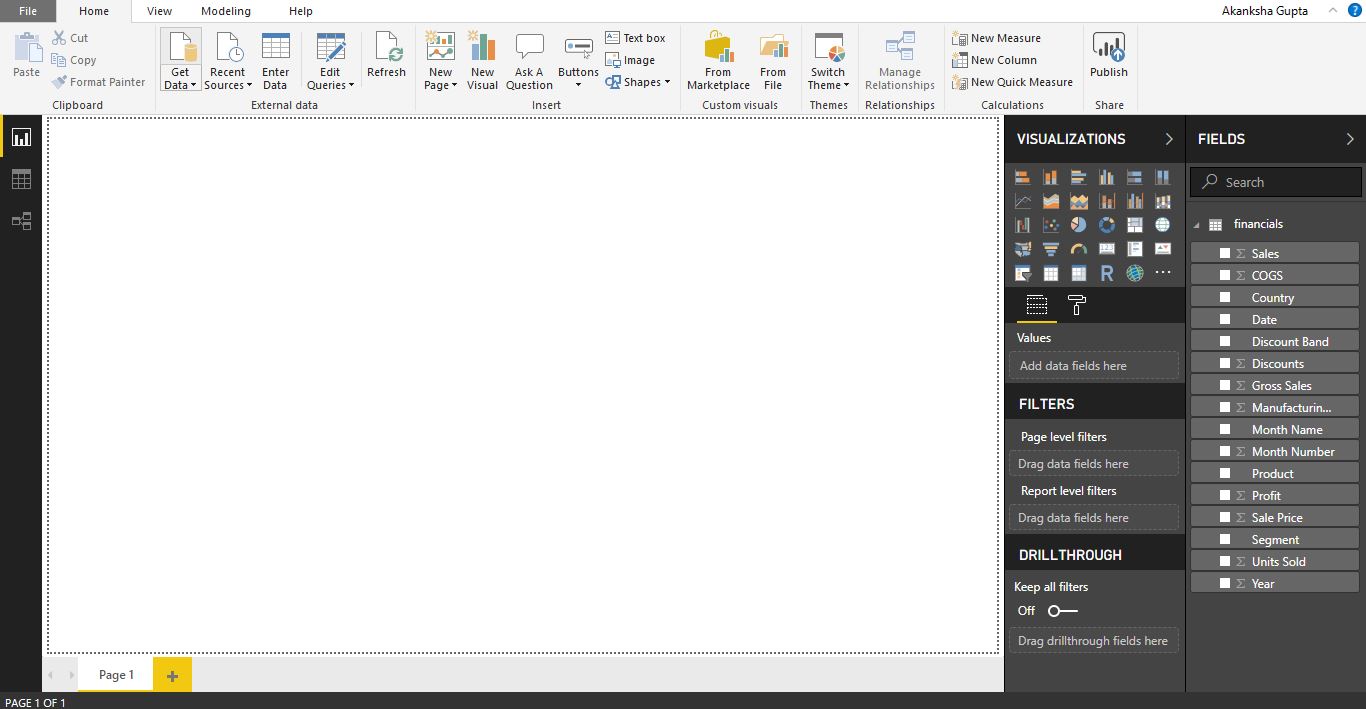
Reports
A Report is a collection of visualizations that appear together on one or more pages. Items in a report are related to each other. We can create reports in PowerBI Desktop or PowerBI Service. Below is a report developed in PowerBI Desktop.

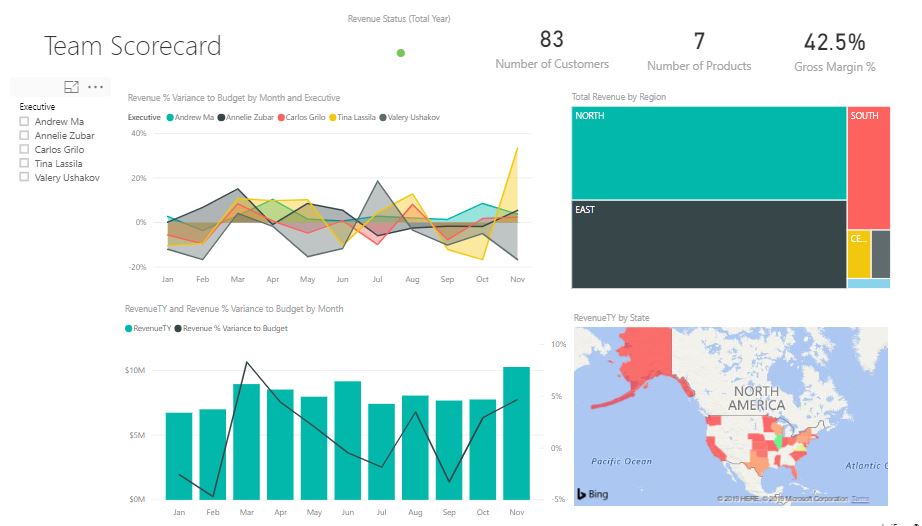
Dashboards
When all the reports and visualizations are ready and we want to share them with other users, we create Dashboards. Dashboard should fit in a single page, called as canvas.
Tiles
A Tile is a single visualization on a report or a dashboard. It is a rectangular box that holds an individual visual. We can move these tiles wherever we want within a report or dashboard or change their size.