- Let’s create a sample report using PowerBI Desktop and publish it onto PowerBI Online.
- For this, I am using the Financial Sample Workbook available on Microsoft Docs. You can get it from here.
- Download the Excel file and save it on your desktop.
- Analyze the Excel carefully and see what are the useful reports that you can make from it.
- We have Sales Data in this file.
- Open PowerBI Desktop.
- Go to Home –> Get Data. Click on Excel.

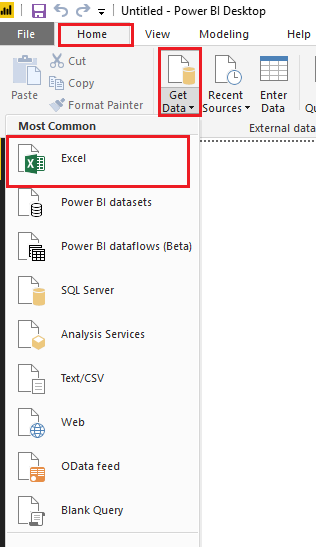
- Open the downloaded Financials file. Select financials table. Load it.

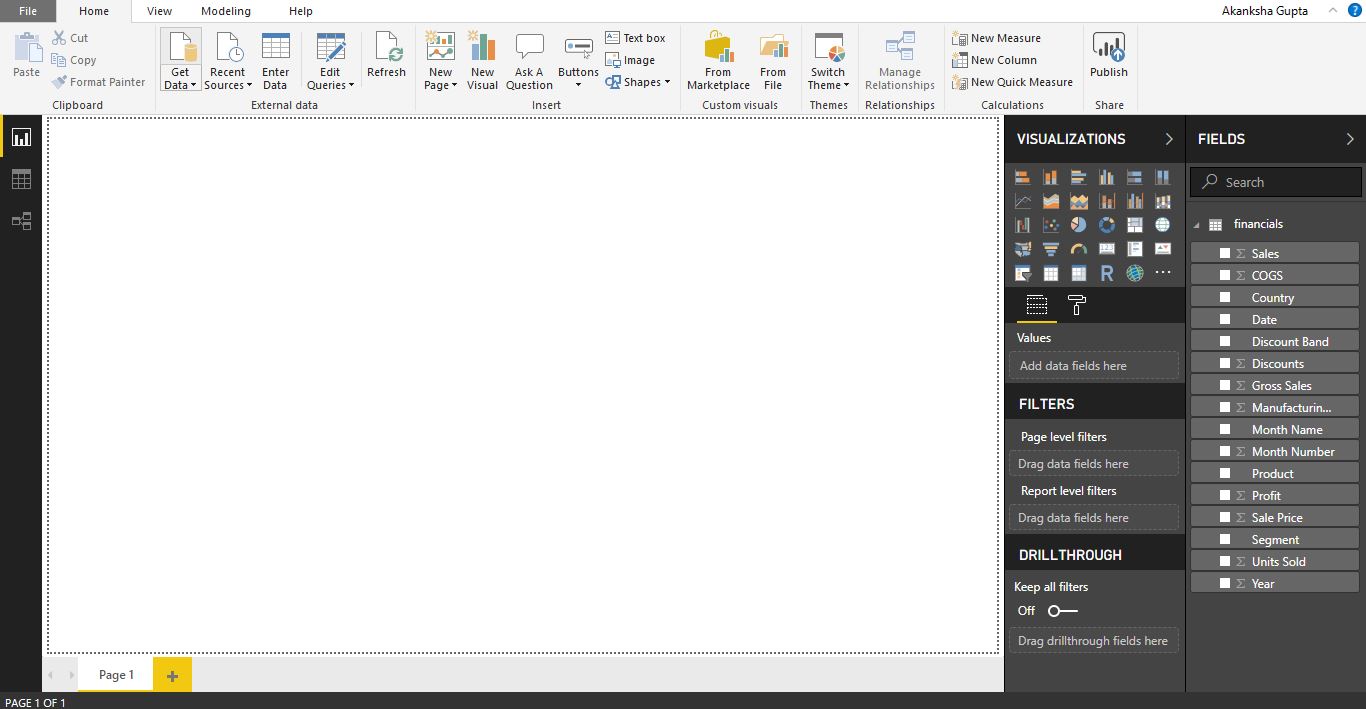
- This is how it will look by default when a file is loaded.
- You can see all the column names of the excel on right hand side, under Fields section, from where you can drag and drop them to create the report.
- Under Visualization section, You can see many options like different types of charts we can create, filters we can apply etc. Remember that the reports and charts that you create from a single database are all interlinked.

- Drag and Drop Sales field on the report. You will see a Column Chart on the report.
- Now drag Product field on the same chart. It will look like below.

- Let’s add a Map on the report. Double click on Map. You will a see a map appearing on the report.
- Drag the Country field on the Map. Below is how the Map will look highlighting the countries in which the Sales are made.

- Create one more chart, which will display Sales by Segment.
- Below is how final Report will look like. You can increase/decrease the size of the charts.

There reports are interactive. You can select a country and can see the changes in other reports. - If you want to Publish this report on PowerBI Service,login to PowerBI Online and click on Save, give a name and Publish.
- Select a destination where you want to Publish your report. I am publishing it to My Workspace as of now.
- You will get a Success message when the report is successfully published. You can open the report directly from this message.

- You will be able to see your report under My Workspaces group in your PowerBI Service. It will work interactively.


